
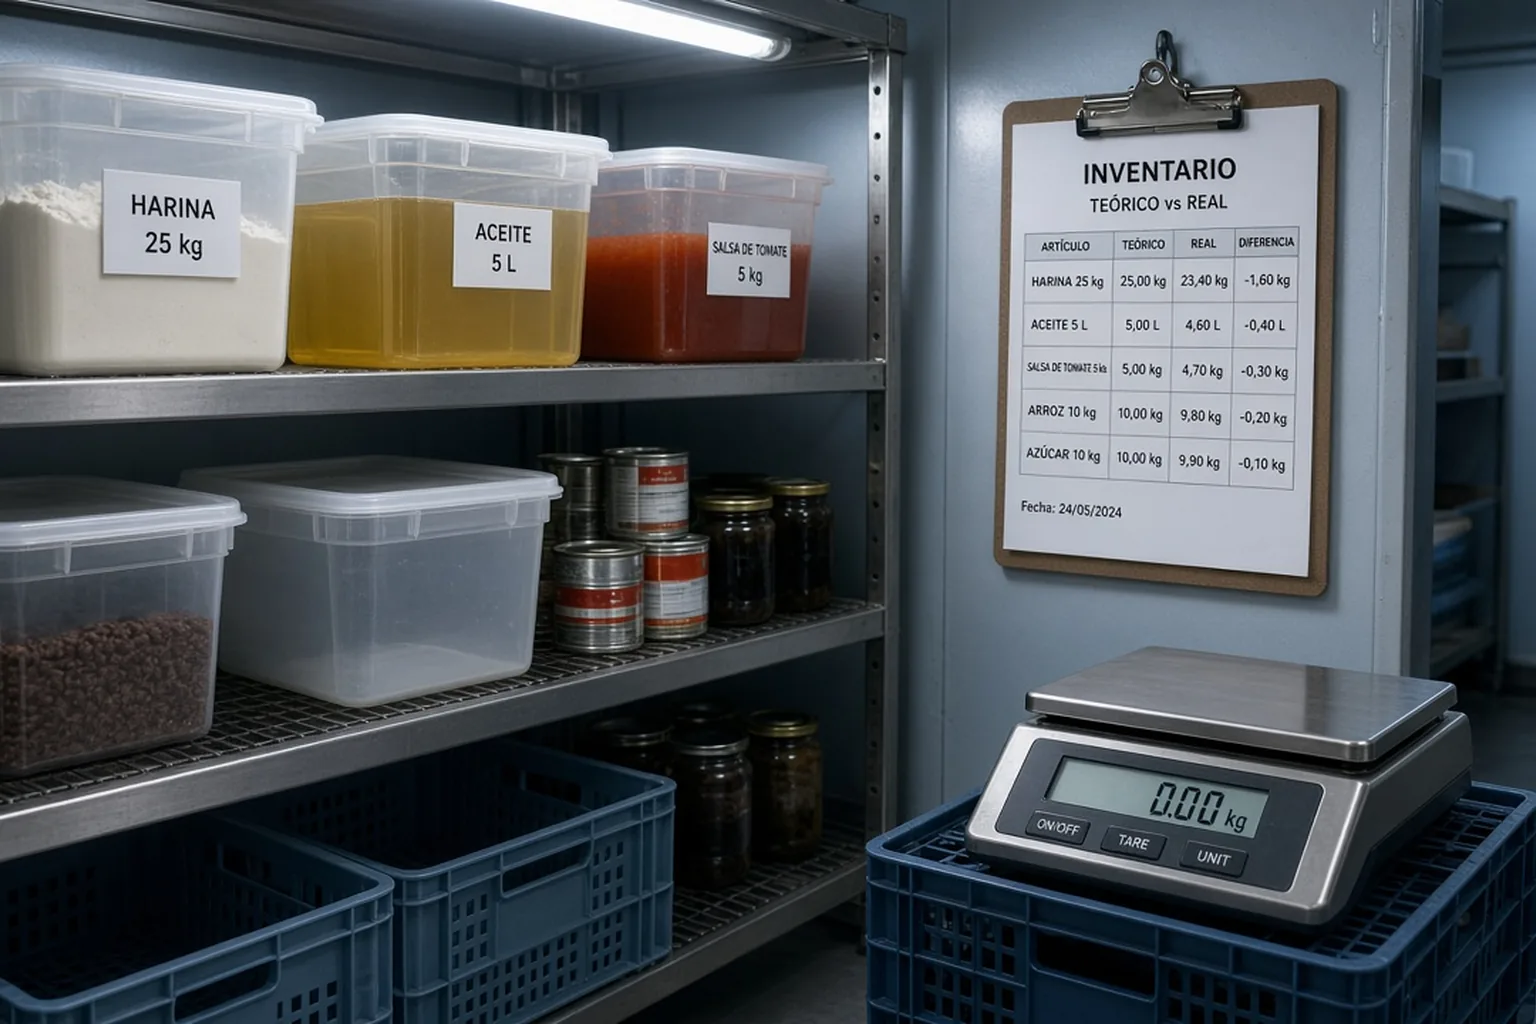
Theoretical vs actual inventory: why they never match and in what order to find the cause
By Samuel Carrillo10 min read
Published 22 October 2026.
«Nothing gets thrown away here»
You've pulled the theoretical, counted the cooler, and octopus is missing. A lot of octopus.
You tell the head chef and they swear: nothing gets thrown away here.
They're probably right.
Most mismatches aren't in the cooler: they're on the recipe card, the delivery note or the POS. If you start looking in the kitchen, you start with the costliest place to audit.
How much difference between theoretical and actual is normal?
Theoretical inventory is what should be left in storage based on what you bought, what you sold and the grams on each recipe costing.
Variance is calculated ingredient by ingredient: what you actually used, minus what you should have used, divided by what you should have used.
Between 3% and 5% of what you should have used is normal in a restaurant that costs recipes properly. It's the range we see in the sites we work with, not a figure published by anyone.
Above 5%, or below zero, it's time to dig.
Before you dig, the catch: the theoretical is only as good as your recipe costings. If the card was done by eye, the mismatch is on the card and you won't find anything in the cooler.
Step 1. Compare kilos before euros
Put each ingredient in two columns: units and euros.
If kilos match and euros don't, product isn't missing: prices aren't updated. Oil went up in September and the card still has March's price.
The trap is fixing it only on the card. If cost rose, your margin already fell, and that gets fixed on the menu.
Step 2. See whether the mismatch is spread or concentrated
Rank your 20 ingredients from highest to lowest variance.
If they all drift similarly, the cause is systemic: delivery notes not entered, a bad count or sales mis-ringed. Nobody walks off with a little of everything.
If one or two spike and the rest is in range, the cause is physical and has a direction: that product and the dishes that use it.
The trap is looking only at the total. A 4% overall can hide one ingredient at 20%.
Why doesn't my restaurant inventory match?
If kilos are off, the product left through one of four places. Check them from cheapest to most uncomfortable.
Office: you can fix it without leaving your chair
- Recipe costings by eye. «A handful», «a splash», «a normal portion». If the quantity wasn't weighed, the theoretical is a guess.
- Delivery notes and credit notes not entered. An order without a note makes you look like you used less than you should. A return without a credit makes you look like you used more.
- The POS. A dish rung on the «misc» button gets paid for but doesn't deduct ingredients. For the theoretical, it never left.
Receiving: what you pay for isn't what comes in
- The box that doesn't weigh what it says. If nobody weighs on delivery, you sign the supplier's weight.
- The ice on frozen product. Fish glaze is paid for at fish price and turns into water in the cooler.
- The substituted product. Another calibre or brand, same price on the delivery note.
The trap: trusting the delivery-note weight because the supplier is reliable.
Kitchen: portions, waste and overproduction
- The portion on the pass. If the card says 200 grams and 240 go out, those 40 come out of your margin.
- Trim yield. If real yield is worse than the card, product goes missing without anyone throwing it away. To measure it without fuss, one week logging what goes in the bin gives you the number.
- What you produce too much of. Prep that expires before it sells.
Floor: what leaves without going through the till
- Comps not logged. The house round, the shot, the birthday dessert.
- Staff meals not recorded.
If the mismatch concentrates in drinks, desserts and bread, start here. And the last thing you look at is people.
What if inventory comes out in my favour?
A favourable mismatch is usually an error: a delivery note you haven't entered, an over-count, or a card that lists more than you serve.
If it's the last one, the guest is getting less than you pay for on your costing. It deserves the same review as a loss.
The octopus nobody threw away
Made-up example to teach the maths, with a pattern we have yet to miss in any site we've reviewed: a dish costed without a scale. Cooked octopus at €28 a kilo ex-VAT.
| Galician-style octopus, one month | |
|---|---|
| Portions sold | 220 |
| Octopus per portion on the card | 150 g |
| Octopus per portion weighed on the pass | 185 g |
| What should have been used | 33 kg |
| What was actually used | 40.7 kg |
| Variance | 23% |
| Difference in euros | €215.60 a month |
The head chef was right: nothing was thrown away. The cook put 185 grams every time, always the same.
The 150 grams on the card were put in by eye the day the menu was built.
The portion doesn't cost €4.20: it costs €5.18. At €16 on the menu, which is €14.55 ex-VAT, dish food cost isn't 28.9%, it's 35.6%.
Variance
23%
Per month
€215.60
Per year
€2,600
That's about €2,600 a year. And it isn't money that disappears: it's a price set on a cost that never existed.
There are three ways out: portion to 150 grams, raise the price, or accept the margin knowing what it is. Any is fine if it's a decision.
What this routine doesn't tell you
One month isn't enough. An isolated spike can be a counting error. If the same ingredient drifts two months in a row, it isn't chance.
Ingredients that go in everything don't point anywhere. Oil, salt or flour spread across so many dishes that the variance doesn't tell you where to look.
What sits outside your 20 ingredients, you don't see. Review the list every quarter against delivery notes, as we cover in the guide to counting only what weighs in euros.
Our 3% to 5% is measured on what you should have used. Several kitchen-software vendors publish thresholds of 1 to 3 points, but measured on sales. They don't contradict each other: at 30% food cost, a 4% usage variance is a bit more than one point on sales.
And it tells you where, not who. That conversation happens with your team once the numbers are reviewed.
If your variance is over 5% and you don't know which of the four places to check, write to us and we'll put numbers on it: reviewing 20 ingredients will tell you whether things are sound in your business.
Before you talk to anyone, pick up the scale.
Is your variance over 5%?
Write to us and we'll put numbers on it: reviewing 20 ingredients will tell you whether things are sound in your business.
From Tipi we help you see where the gap opens between theoretical and actual.
Sources
- Normal variance range of 3% to 5% of food cost: Tipi's criterion from the sites it works with.
- Variance thresholds measured in points on sales: published guides from meez and Supy, kitchen management software vendors.
- Octopus case, variance formula and conversion to euros: Tipi's own workings.